


Real-time applications rarely depend on a message broker alone.
A user places an order, sends a message, updates a dashboard, or triggers a downstream workflow. Behind that one action, the application often has to write data durably, publish an event, route it to the right subscribers, update a cache, compute an aggregate, and make the result queryable.
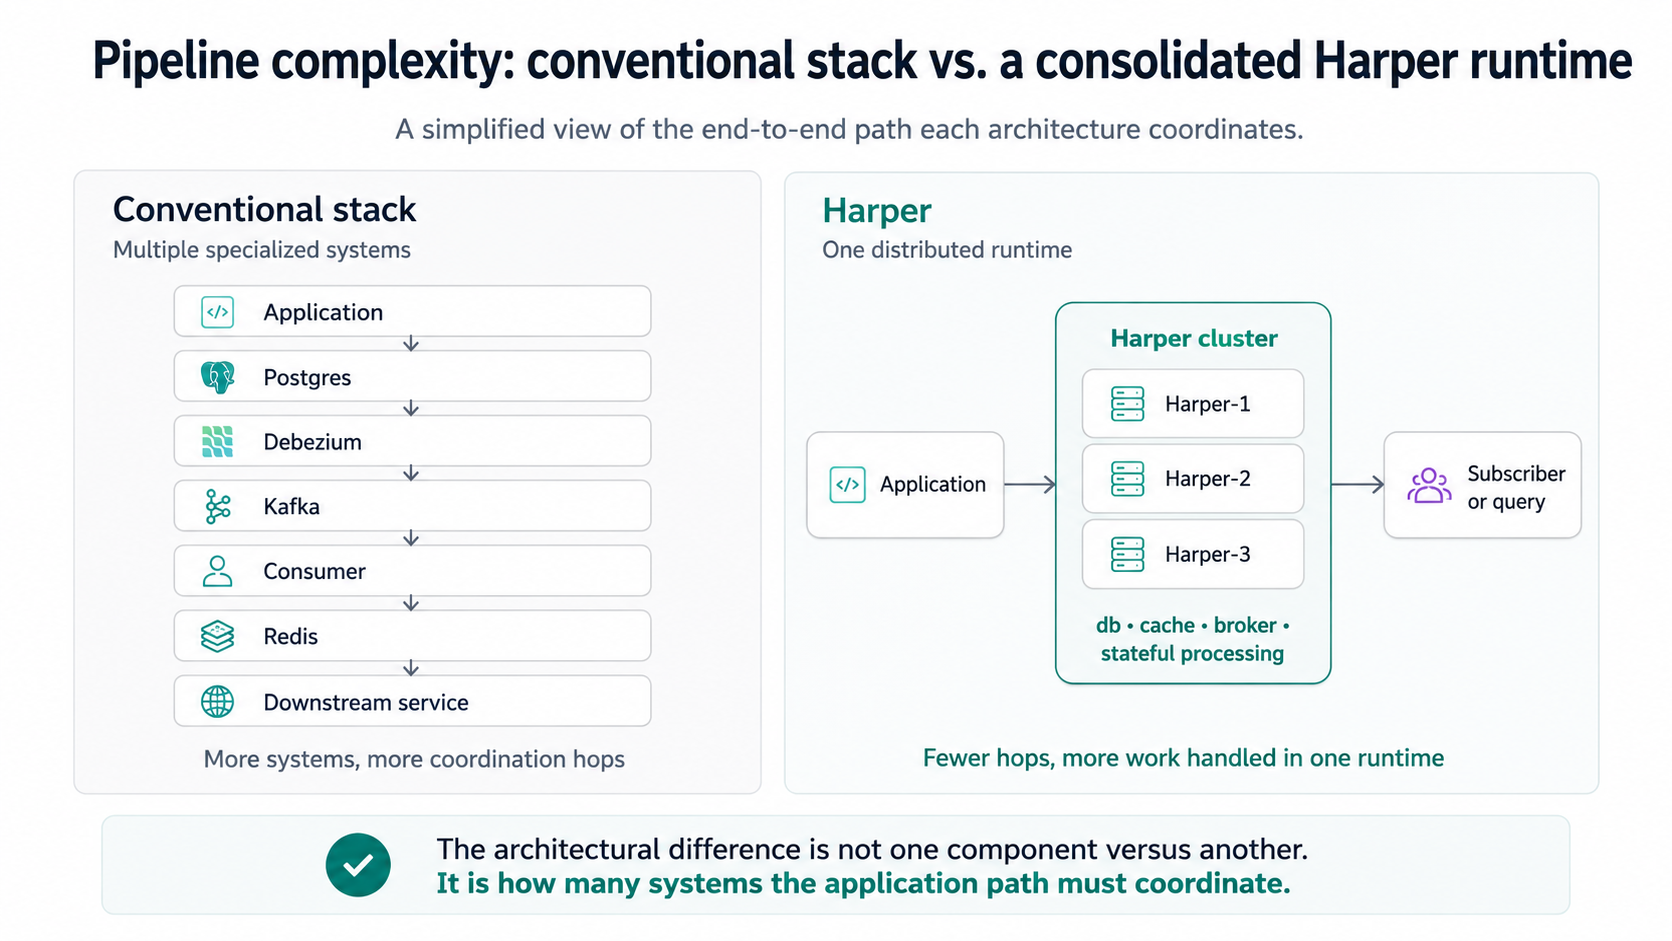
In conventional architectures, that usually means combining several specialized systems: Kafka for event streaming, Postgres for durable storage, Debezium for change data capture, Redis for routing or caching, Kafka Streams for stateful processing, and custom services to glue the pieces together.
Each system may be fast on its own. The question is what happens when the application has to coordinate across all of them.
What we tested
We built four common real-time application pipelines two ways:
- A conventional Kafka-centered stack using systems such as Postgres, Debezium, Redis, and Kafka Streams where each workload required them.
- A single Harper cluster that combines data storage, messaging, caching, and application logic in one runtime.
The goal was not to benchmark Kafka in isolation. Kafka is a proven, highly scalable event streaming platform, and production Kafka deployments on real hardware can support far higher throughput than a local laptop test can measure.
Instead, this study focused on end-to-end application latency: the time a user- or application-visible event spends moving through the full pipeline.
Read the Full Report Here
What we found
Across the four workloads, Harper showed lower end-to-end latency on three:
That last result matters. Kafka Streams Interactive Queries are designed for fast point reads against local state, and the benchmark reflects that. This is not a “one tool wins everything” story. It is an architecture-fit story.
The architecture lesson
The most consistent finding was not just that Harper had lower median latency on most workloads. It was that Harper’s tail latency stayed tighter.
In multi-system pipelines, latency compounds across each hop: database commit, change-data-capture delay, broker replication, consumer polling, cache lookup, application routing, and downstream notification. Even when each step is individually fast, the user waits for the sum.
Harper reduces that coordination path by running the database, cache, message broker, and application logic inside one distributed runtime. For workloads dominated by write-and-notify flows, filtered fan-out, and live aggregate freshness, fewer systems means fewer places for latency and variance to accumulate.
How to read the results
This study is intentionally narrow and reproducible. It ran on identical laptop-VM hardware, with per-workload durability matched between implementations. The Kafka pipelines used replication factor 3, min.insync.replicas=2, acks=all where applicable, lz4 compression, and batching.
That setup is useful for comparing architectural overhead on the same hardware. It is not a production throughput claim.
In particular, the sustained-ingestion workload should be read carefully. Above roughly 1,000 events per second, the laptop VM became the limiting factor for both stacks. Kafka is purpose-built for high-throughput ingestion, and production-scale validation on real Linux hardware is the right next step for that workload.
When Harper fits
This study suggests Harper is a strong fit when your application is dominated by:
- Durable writes that need to trigger downstream work quickly
- Real-time messaging or filtered fan-out
- Live dashboards where aggregate freshness matters
- Architectures where multiple systems are adding operational and latency overhead
Kafka and Kafka Streams remain strong choices when your dominant need is specialized event streaming, production-scale log ingestion, or sub-millisecond point reads from local stream-processing state.
For many real systems, the answer may be both: use Harper where consolidation improves the application path, and use specialized streaming infrastructure where that specialization owns the latency or throughput budget.
Methodology and fairness controls
The benchmark was designed as a whole-stack comparison, not a bare Kafka benchmark. Each workload compared Harper against the conventional pipeline that would typically be assembled to perform the same job.
The study also included several fairness controls:
- Kafka was configured with
replication factor 3,min.insync.replicas=2, andacks=allwhere applicable. - Durability was matched per workload. For example, Harper used
replicatedConfirmation: 1where the Kafka pipeline waited for two durable copies. - The headline write-and-notify workload included a Node.js control implementation to reduce the chance that the result was simply a Go-vs.-Node.js language difference.
- The methodology and decision log were published openly in the repository.
- The Kafka Streams point-query result, where Kafka won, was kept in the headline results.
Those details matter because performance studies are easy to overstate. This one is most useful when read as an architectural comparison: what happens to end-to-end latency when an application path requires several systems to coordinate versus when the same work runs inside one distributed runtime.
Limitations
The study ran on a single laptop VM. That makes the results reproducible and useful for comparing relative architectural overhead on identical hardware, but it does not make them production throughput numbers.
The sustained-ingestion result is especially limited. Above roughly 1,000 events per second, the test environment became the bottleneck for both systems. Real hardware, real NVMe disks, and multi-node Linux deployments are the right environment for validating high-throughput ingestion behavior.
The study also did not include a named independent Kafka expert review before publication. That kind of review would be valuable, and the open methodology makes it possible for others to inspect, challenge, and rerun the benchmark.
Read the full study
The full performance study includes the workload definitions, headline results, methodology, fairness controls, limitations, configuration details, and reproduction steps.
Download the full report to see the detailed results and review the open methodology.
A note on how this study was created
This benchmark was developed using an AI-assisted workflow. I used AI coding tools to help build, run, inspect, and revise the test harnesses, while repeatedly checking the methodology for weak comparisons, strawman configurations, and overstated claims.
That workflow included iterative review across multiple models, including Claude Code for implementation support and OpenAI Codex for verification, critique, and methodology review. The purpose of that process was not to replace technical scrutiny, but to make the work more reproducible, more explicit, and easier for others to challenge.
Because of that, the study leans heavily on open methodology: the workloads, configuration, decision log, limitations, and reproduction steps are published for review. If a stronger Kafka configuration, workload design, or interpretation holds up, it should be incorporated.

.webp)


.jpg)