


Explore the complete source code and k6 benchmarks used to test both architectures side-by-side: https://github.com/HarperFast/harper-vs-microservices-perf-test
Executive Summary
This benchmark compares two functionally equivalent e-commerce applications built with different architectural approaches: a Unified Harper Runtime and a Standard Microservices Stack. Both implementations serve identical data models, UI components, and user workflows, differing only in their underlying architecture. Testing was conducted using k6 across three page types—Homepage, Product Listing Page (PLP), and Product Detail Page (PDP)—at concurrency levels of 20, 200, and 2,000 virtual users (VUs).
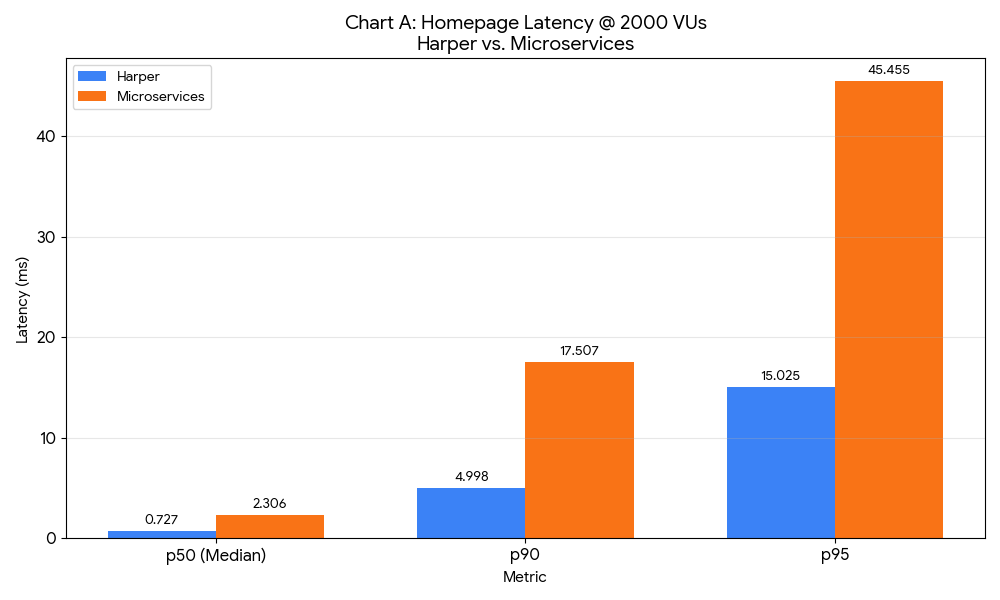
Key findings: Harper demonstrated sub-millisecond p50 latency (0.73ms) on the homepage at 2,000 VUs, while maintaining 100% success rates across all tests. The microservices stack exhibited catastrophic failure at 200+ VUs for PLP and PDP scenarios, reaching 100% error rates due to timeout and connection exhaustion. Even at low concurrency (20 VUs), the microservices architecture showed 3-10x higher latency due to network serialization overhead between services.
It's important to note that these tests were conducted on localhost, representing a best-case scenario for microservices. In production environments with physical network infrastructure, routers, switches, and inter-datacenter links, the performance gap would be significantly larger.
What This Repo Contains
- Two functionally equivalent e-commerce applications: One built on Harper's unified runtime, one on a standard microservices architecture
- Interactive UI with architecture toggle: Allows visual confirmation of functional parity between implementations
- Comprehensive k6 benchmark suite: Automated testing across multiple page types and concurrency levels
- Complete test result artifacts: JSON outputs from all benchmark runs (18 test scenarios)
- This detailed write-up: Analysis, methodology, and interpretation of results
Architecture Overview
Microservices Stack
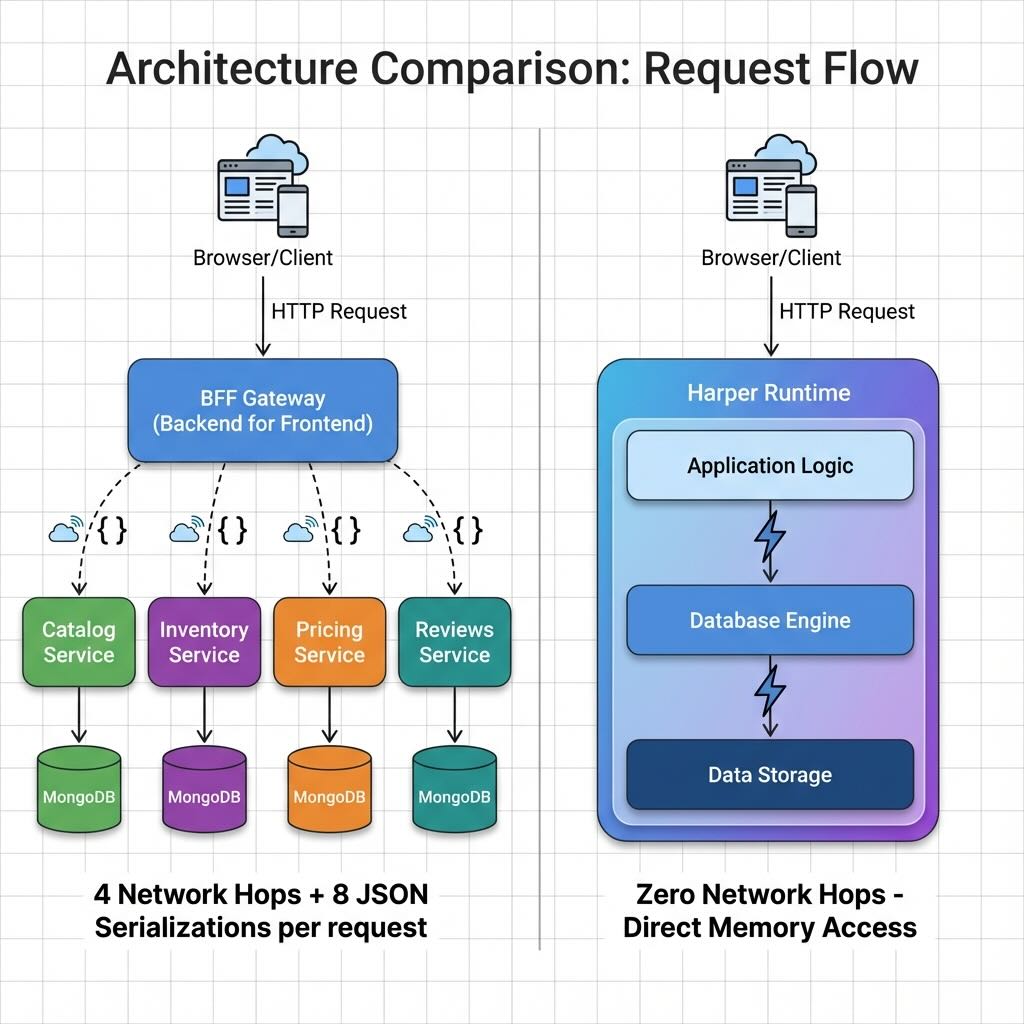
The standard microservices implementation follows conventional distributed architecture patterns:
- Four independent services: Catalog, Inventory, Pricing, and Reviews services, each running as separate Fastify processes
- Backend-for-Frontend (BFF) Gateway: Orchestrates requests across services, aggregating data from multiple sources
- Separate MongoDB collections: Each service maintains its own database collection, enforcing data isolation
- Network hops on every request: Even on localhost, each page load requires HTTP calls from the BFF to 2-4 backend services, with JSON serialization/deserialization at each boundary
- Connection pooling overhead: Each service maintains its own database connection pool and HTTP client pool
Harper Unified Runtime
Harper's architecture eliminates distributed system overhead through unification:
- Single runtime process: Database, application logic, and caching coexist in the same memory space
- Direct memory access: Application code interacts with data via in-process references, not network calls
- Zero internal serialization: Data flows between layers without JSON encoding/decoding
- Efficient aggregation: Complex queries that join across entities (products + inventory + pricing + reviews) execute as single operations without network round-trips
- Unified resource management: Single connection pool, single event loop, single memory heap
Why This Comparison Is Valid
- Identical data model: Both stacks use the same product catalog (~1,200 items), with identical relationships between products, inventory, pricing, and reviews
- Identical API contracts: Both expose the same REST endpoints with identical JSON response structures
- Identical UI: Both serve the same static frontend assets and page templates
- Same hardware: All tests run on the same Apple M1 Max machine with 32GB RAM
- Only architecture differs: The sole variable is how the application logic, data persistence, and aggregation are organized—unified vs. distributed
Test Environment
Hardware:
- Apple M1 Max (10-core CPU)
- 32GB RAM
- macOS
Network Context: All tests were conducted on localhost. This represents the best-case scenario for microservices, as it eliminates:
- Physical network latency (typically 0.1-1ms within a datacenter)
- Network switch/router overhead
- Packet loss and retransmission
- Network congestion
- Cross-availability-zone or cross-region latency
In production environments, microservices would face additional overhead from physical network infrastructure, load balancers, service meshes, and potential cross-datacenter communication. The performance gaps observed in this localhost benchmark would be significantly larger in real-world deployments.
Methodology
Load Testing Tool: k6 (open-source load testing framework)
Concurrency Levels: Tests were executed at three concurrency levels:
- 20 VUs: Low load, representing typical daytime traffic
- 200 VUs: Medium load, simulating peak shopping hours
- 2,000 VUs: High load, stress-testing architectural limits
Metrics Collected:
- p50 (median) latency: The latency at which 50% of requests complete
- p95 latency: The latency at which 95% of requests complete (captures tail latency)
- Throughput: Requests per second
- Error rate: Percentage of failed requests (timeouts, connection failures, 5xx errors)
Test Scenarios:
- Homepage: Displays category tiles and hero content
- PLP (Product Listing Page): Shows 20-50 products per category with basic details
- PDP (Product Detail Page): Aggregates product data, inventory, pricing, and reviews
Note on Errors: High error rates in the microservices stack at 200+ VUs indicate saturation—the architecture reached its coordination limits, resulting in timeouts and connection pool exhaustion. This is not a code bug but an architectural ceiling.
Results
Highlights
6.1 Summary Table: p50 Latency by Page Type and Concurrency
*Microservices experienced partial failures (3.3-35.3% error rates) even at 20 VUs for PLP and PDP.
6.2 Summary Table: p95 Latency by Page Type and Concurrency
*Microservices experienced partial failures even at 20 VUs for PLP and PDP.
Saturation Summary: Microservices Failure Points
Critical observation: These failures occurred on localhost, where network latency is near-zero. In production environments with real network infrastructure, the saturation point would occur at even lower concurrency levels.
Key Takeaways
- Sub-millisecond performance at scale: Harper achieved p50 latencies below 1ms for homepage and PDP scenarios even at 2,000 concurrent users, demonstrating that unified architectures can maintain exceptional performance under load.
- Catastrophic microservices failure: The microservices stack reached 100% error rates at 200 VUs for PLP and PDP, indicating an architectural ceiling rather than a tuning problem. The coordination overhead of distributed services created a hard limit on scalability.
- Localhost is best-case for microservices: All tests ran on localhost, eliminating physical network latency. Production deployments would show even larger performance gaps due to network overhead, making the unified architecture's advantage more pronounced.
Interpretation
The Fragmentation Tax
Every request in the microservices architecture pays a "fragmentation tax" consisting of:
- Network serialization: Data must be encoded to JSON, transmitted over HTTP, and decoded at each service boundary
- Connection overhead: TCP handshakes, connection pool management, and socket operations for each inter-service call
- Coordination latency: The BFF must wait for responses from multiple services before assembling the final response
- Context switching: Each service runs in a separate process, requiring OS-level context switches
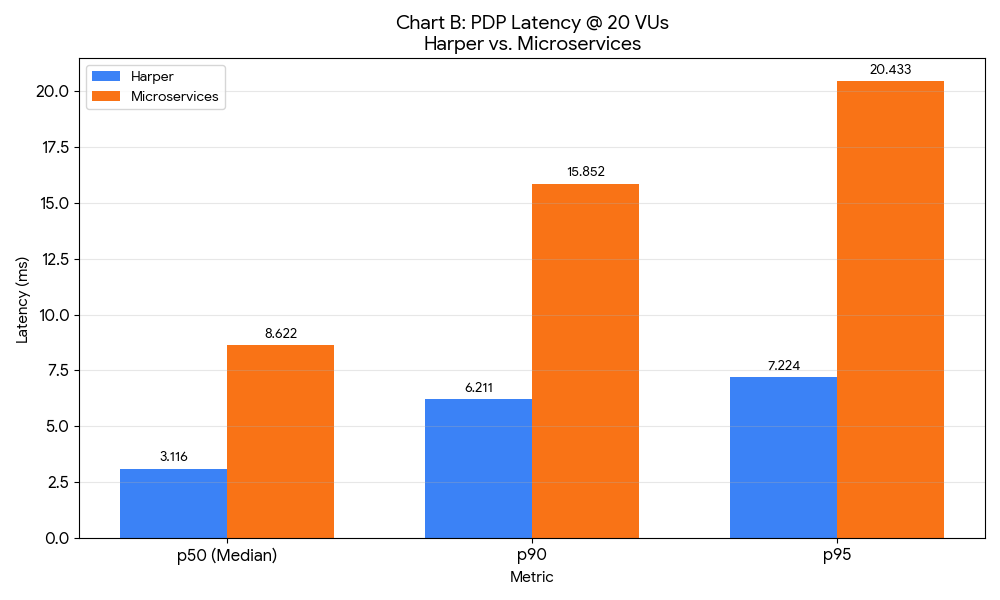
Even on localhost with near-zero network latency, these overheads compound. A single PDP request requires the BFF to call 4 services (Catalog, Inventory, Pricing, Reviews), resulting in 4 network round-trips, 8 JSON serialization operations, and coordination logic to merge results. This overhead is visible even at 20 VUs, where microservices show 3-10x higher latency than Harper.
Why Harper Stays Low-Latency
Harper's unified runtime eliminates the fragmentation tax entirely:
- Shared memory space: Application logic and data coexist in the same process, allowing direct memory references instead of network calls
- Zero internal serialization: Data flows between layers as native JavaScript objects, not JSON strings
- Single-operation aggregation: Complex queries that join products, inventory, pricing, and reviews execute as single database operations without coordination logic
- Unified resource management: A single event loop and connection pool eliminate the overhead of managing multiple processes
The result is sub-millisecond p50 latency for most scenarios, even under high concurrency. Harper's performance profile remains remarkably flat as load increases, demonstrating architectural resilience.
Failure Is Overhead, Not Defect
The 100% error rates observed in the microservices stack at 200+ VUs are not bugs—they are architectural saturation. The distributed coordination required to serve each request creates a ceiling on throughput:
- Connection pool exhaustion: Each service has a finite connection pool; under high load, services wait for available connections
- Timeout cascades: When one service slows down, upstream services time out waiting for responses, triggering retries that amplify load
- Coordination bottleneck: The BFF becomes a coordination bottleneck, spending CPU cycles managing concurrent requests to multiple downstream services
This saturation occurred on localhost, where network latency is minimal. In production, with real network infrastructure, the saturation point would occur at much lower concurrency levels.
Business Implication
Research shows that ~100ms of additional latency correlates with ~1% reduction in conversion rates for e-commerce applications. The performance gaps observed in this benchmark translate directly to business impact:
- At 200 VUs, Harper's homepage responds in 0.88ms (p50) vs. microservices' 7.07ms—a 6.19ms difference that could impact user experience
- For PLP and PDP, microservices fail entirely at 200+ VUs, resulting in 100% lost conversions during peak traffic
While this benchmark does not measure conversion rates directly, the latency and reliability differences suggest meaningful business consequences for high-traffic e-commerce platforms.
Limitations
- Localhost best-case: All tests ran on localhost, eliminating physical network latency. This represents the best possible scenario for microservices. Production environments with real network infrastructure would show larger performance gaps.
- Workload-specific: This benchmark focuses on e-commerce page loads with data aggregation. Other workloads (e.g., write-heavy operations, long-running transactions) may show different performance characteristics.
- Not a universal verdict: Microservices architectures offer benefits beyond raw performance, including organizational boundaries, independent deployment, and technology diversity. This benchmark isolates performance and does not evaluate those trade-offs.
- Measurement precision: k6's summary output provides p90 and p95 percentiles but not full percentile distributions (P0-P98). Detailed tail latency analysis would require raw timeseries data or custom k6 output configurations.
- Single hardware platform: All tests ran on Apple M1 Max. Results may vary on different CPU architectures, memory configurations, or operating systems.
Conclusion
This benchmark demonstrates that architectural choices have profound performance implications. The Harper unified runtime achieved sub-millisecond p50 latency and 100% success rates across all test scenarios, while the microservices stack experienced catastrophic failures at moderate concurrency levels (200+ VUs) and showed 3-10x higher latency even at low loads.
The performance gap stems from fundamental architectural differences: Harper eliminates network hops, serialization overhead, and distributed coordination by colocating application logic and data in a single runtime. The microservices stack, despite running on localhost in ideal conditions, pays a "fragmentation tax" on every request.
For organizations prioritizing performance, system efficiency, and operational simplicity, the unified runtime model offers clear advantages. For teams that value organizational boundaries, independent deployment cycles, and technology diversity, microservices may justify the performance trade-off. This benchmark provides data to inform that decision, showing the concrete costs of distributed architectures in latency, reliability, and scalability.
Readers should interpret these results in context: localhost testing represents the best-case scenario for microservices. Production environments with real network infrastructure would amplify the performance gaps observed here, making the unified architecture's advantages even more pronounced.

.webp)


.jpg)